


Creating Art and Caring for the Planet

Rendering 3D Cities

We Made a Huge 3D Terrain Map of Colorado

11 Essential Resources for Your Digital Mapping Toolbox
My fascination with digital mapping started over twenty five years ago when I first discovered the now-outdated SDTS-formatted third-arcsecond digital elevation models on the United States Geological Survey (USGS) FTP site.
Eager to combine the trove of data from the USGS with the new technology of 3D printing, in 2010 I launched TinyMtn, which today sells over 1,000 different models of the world’s most famous mountains, canyons, ski resorts, golf courses, and race tracks.
Since TinyMtn’s humble beginnings, digital mapping has undergone an explosion in the availability, resolution, and precision of geographic data.
Today, TinyMtn and now MiniCityArt are able to harness this veritable goldmine of data thanks to a number of essential tools and platforms.
Here is a list of indispensable resources in my digital mapping toolbox.
1. Google Maps

The most popular and universally accessible database of maps is still unrivaled when it comes to virtually scouting any location.
Google typically incorporates new satellite photos and 3d scans shortly after they are released by governments and commercial providers, and augments these with its own data sources.
Most useful are the Terrain and Satellite views, which enable me to scout new mountains for TinyMtn, as well as assess a landscape’s aesthetics. This is the first step in selecting a desirable build area to optimally present the geographic feature.
When generating MiniCityArt models, I use Google Maps 3D view to scout the city, identify unique building shapes, clarify various features, and gather key intelligence on the most interesting areas and popular neighborhoods.
2. Wikipedia

Cities and landscapes aren’t merely the sum totals of their physical features; they are the manifestation of thousands of years of dynamic history and culture.
Overlooking a place’s unique history when designing a model can result in significant omissions and a rather humdrum final product that fails to embody an area’s essence. That is why the story of a place invariably informs my decisions about what to print.
For example, if a historically or culturally significant monument, church, or building is located outside the downtown area on which the print is centered, I’ll consider reframing the print to include it.
As an added benefit, Wikipedia’s lists of tallest buildings in each city are thorough, and help with planning updates to each city.
3. The USGS National Map

The USGS National Map download platform is the data source king — supplying nearly all the data that I use for 3D prints of areas within the United States.
This repository’s most useful data sets for our purposes are: “Elevation Products->⅓ arc-second DEM” ,“Elevation Source Data->Lidar Point Cloud”, and “Imagery - NAIP Plus”. Draw a box, select a data source, search, and download — it’s simple and fast!
4. The Copernicus Open Access Hub

The Copernicus Open Access Hub is my source for high-resolution satellite photographs of Earth.
The European Space Agency (ESA) provides this easy-to-use service with access to mind-boggling amounts of data.
You can download satellite images of your city with a resolution of 10 meters per pixel from as recently as two days ago. It takes a little effort to extract useful full-color images from these approximately 1 GB data packets, but the effort is rewarded with wonderful color imagery of our beautiful planet.
5. Geospatial Data Abstraction Library (GDAL)

Having access to comprehensive data is critical, but none of it would be usable without tools to convert and manipulate it.
GDAL is an excellent open-source library (suite of tools) that I use in many stages of my data processing pipeline, and I am extremely thankful for the programmers who have diligently developed these tools over the years.
Simply put, no open-source digital mapping toolkit is complete without GDAL.
6. Spatial Reference Catalog

It’s no surprise that presenting a spherical surface on a flat map or screen is intrinsically problematic.
A “projection” is a method for transforming positions on a globe (in degrees) into horizontal positions using measures of length (miles, kilometers). There are infinitely many possible projections, and map-makers must choose one when creating a flat map of our curved Earth.
To aid in this effort, SpacialReference.org catalogs tens of thousands of these projections, coded using a variety of formats.
I’ll use either the Proj.4 code or the EPSG code for a desired projection, depending on the stage of my data processing pipeline. And I prefer UTM zones for their generality and meters for consistency.
I’m a metric person because I remember trying to perform thermodynamic calculations by hand in English units, and it upset me as much as English* food does. Measurements and food are both better when they are international — delicious and metric.
*Yes, the English use metric now, but they’re still largely responsible for confusing generations of engineering students.
7. ProjFinder

Sometimes — no, frequently — geographic data is distributed without embedded projection information. ProjFinder tells us which projection the original geographer used to generate the data. Once I know this key detail, I can reproject and manipulate it alongside other sources of data. This terrific resource has resurrected a dead project more than once.
8. The National Grid
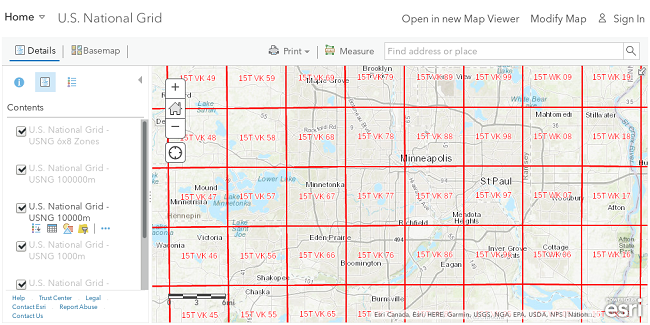
Did you know that the US has a “National Grid” — a general method for locating places within the United States?
Fed Maps is an ideal place to explore it.
Every place in the United States can be located using a code. Gateway Arch in St. Louis is 15S YC 450 788: 15 is the UTM “zone” (6 degrees of east-west longitude), “S” is the code for a band of 8 degrees of north-south latitude. Now the system switches to metric: “YC” is the longitude and latitude of a 100-kilometer sub-block of “15S”, and “450 788“ are hierarchical components of a 100x100 meter area within that. It’s an elegant system.
As you zoom in, you’ll see the unavoidable warping of what could be considered “North” and “South” lines — a side effect of the UTM projection system that vividly illustrates the difficulties of mapping a sphere. [Hey, listen flat-earthers: it’d be mathematically a lot easier if you were right. We don’t do all this extra work for fun, we do it because the Earth is a ball.]
9. Open Topography

This is an excellent source for both unique LiDAR (laser scan) data and an easy portal for downloading worldwide DEM data from Japan’s ALOS satellite.
10. Peakbagger

Attention all armchair mountain enthusiasts (and real ones)!
A “peakbagger” is a mountain climber who methodically records their achievements, often with the aim of summiting all peaks in some category. Peakbagger — the site — is an invaluable asset containing lists and information about the world’s mountains. I typically use it to find the currently-published summit elevations for my new models, but it’s a great site to research new areas to print.
Peakbagger doesn't just tell you the location and summit altitude for each peak, it includes photographs, an interactive map, a hierarchical list of the mountain's ranges, and even a link to the peak's nearest higher neighbor (keep clicking until you get to Mt. Everest)!
11. ACME Mapper
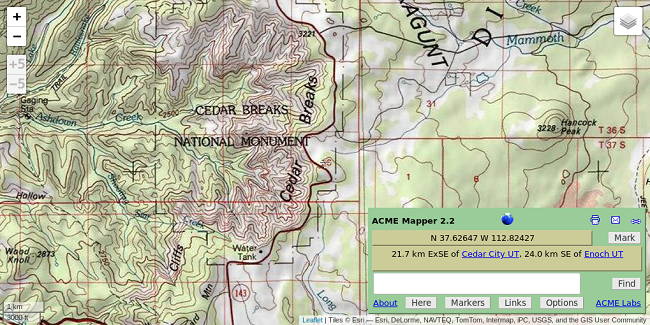
If you want the name of a valley or basin, or a subpeak, or just want to explore beautiful topographic maps, head to the ACME Mapper site.
ACME Mapper lets you zoom in and out of a seamless display of USGS and world “topo” maps, giving you access to more details and a traditional map aesthetic that aren’t available on Google Maps.
—
While there are other tools and information sites that I leverage to print maps and landscapes, the 11 resources listed here are the most integral to the art and science of 3d printing.
I hope you’ve found something here that piques your interest — even if you don’t ultimately want to make maps, and just want to enjoy exploring the wealth of fascinating data at your fingertips.