
I grew up loving maps. Our family’s World Atlas was my go-to book for hours of entertainment, more so than all the other books we had around. I made my first 3D map in 5th grade: a map of the Southeast Asian peninsula for a project on the Vietnam War. Notice the cafeteria tray!

My very first TInyMtn - 3D maps are fun to make.
As a child of the 80’s, I was also into computers. Around 2000, I discovered digital mapping and the USGS data FTP server and realized that mapping and computers were not unrelated. Since then, digital mapping has undergone an explosion in the availability, resolution, and precision of geographic data and tools.
This short talk is intended to be an introduction to geographic data, focusing on data sources and techniques that you can use right now, today, to make something beautiful for your office, home, or computer. But first…
Don’t be Afraid of Data
Apps, operating systems, tools, and global corporations all want to hide from you the fact that data exists. They think that all you want is “solutions.” If you’ve bought into that (and they’ve been pushing it hard since the dawn of the smartphone era), then you probably have something of a fear of data. So let’s remove some layers of obfuscation:
Data is just ones and zeros (“bits”) which when grouped in sequences represent numbers (32 bits or 4 bytes) and letters (8 or 16 bits; 1 or 2 bytes), are stored according to some format specification (like JPEG), and saved on a physical memory device somewhere (RAM, SSD, disk drive, SD card).
Contiguous chunks of data are called files, and are arranged logically in a hierarchy of directories called a filesystem. You have access to this, but it’s not always obvious how.
Programs can open and save files and use the data therein, but only if that app was programmed to support that specific file format. For example, Photoshop opens .jpg but not .docx files. But you - the user - can look at the raw data for any file; it just won’t make much sense.
Types of [Geo]data
Since geographic (and hydro- and oceanographic) data represent properties and qualities of the Earth (or other planets), they must contain spatial (location-related) information. This “metadata” answers the question: what place on Earth does this data represent, and at what time? Since data is in files, the file’s format determines the amount, order, and specification of this metadata and of the data itself.
There are two main methods to represent data with locational properties: raster and vector.

Raster digital surface model and vector triangle mesh of the Evelyn Moakley Bridge in Boston
Raster
Think pixels - grids of squares, mapped to specific locations on the Earth’s surface The locational information is not stored for every data element, instead it is stored once for the entire grid (projection, corners, and pixel size), and the index of the pixels determines the place on the Earth represented by each data element.
Raster file formats that you may already be familiar with include common image formats like JPEG, PNG, and TIFF, and video formats like MP4, MOV, and AVI.
For geographic information, the GeoTIFF is very common - it stores the geographic metadata in headers just before the gridded data elements’ values, but it’s still just a TIFF image. You may also see “JP2”, which is a highly-compressed JPEG format.
The type of data stored in a raster file can vary - it’s not always aerial or satellite photography, but often elevations, land use, temperature, or other useful measurements.
Vector
Data for which each element also stores its position information is called vector data. PDF is probably the most common vector format file, followed by EPS (encapsulated PostScript) and a host of others. If you use Adobe products, you already know that Illustrator is the vector drawing tool and Photoshop manipulates raster data.
Vector data is very frequently used in Geographic Information Systems (GIS), where knowing precise property boundaries has significant monetary and legal weight. These “cadastral” files and other line-based vector data like roads, coastlines, and borders are often in a format called “Shapefile.”
Property and other boundaries are examples of line-type vector data, but for the artwork here, I use two other types of vector data: point clouds and triangle meshes. Point clouds are generally stored in LAS format and are the product of aerial or terrestrial laser-scanning - the data is simply three numbers for each laser “hit” and represent a point in space. Triangle meshes are the key data type used in 3D printing, are usually in STL format, and include not just 3D points in space, but connectivities among those points to form triangles.
Going Beyond Google Maps: Data Sources
It’s time to get active! Let’s download and view some geodata!
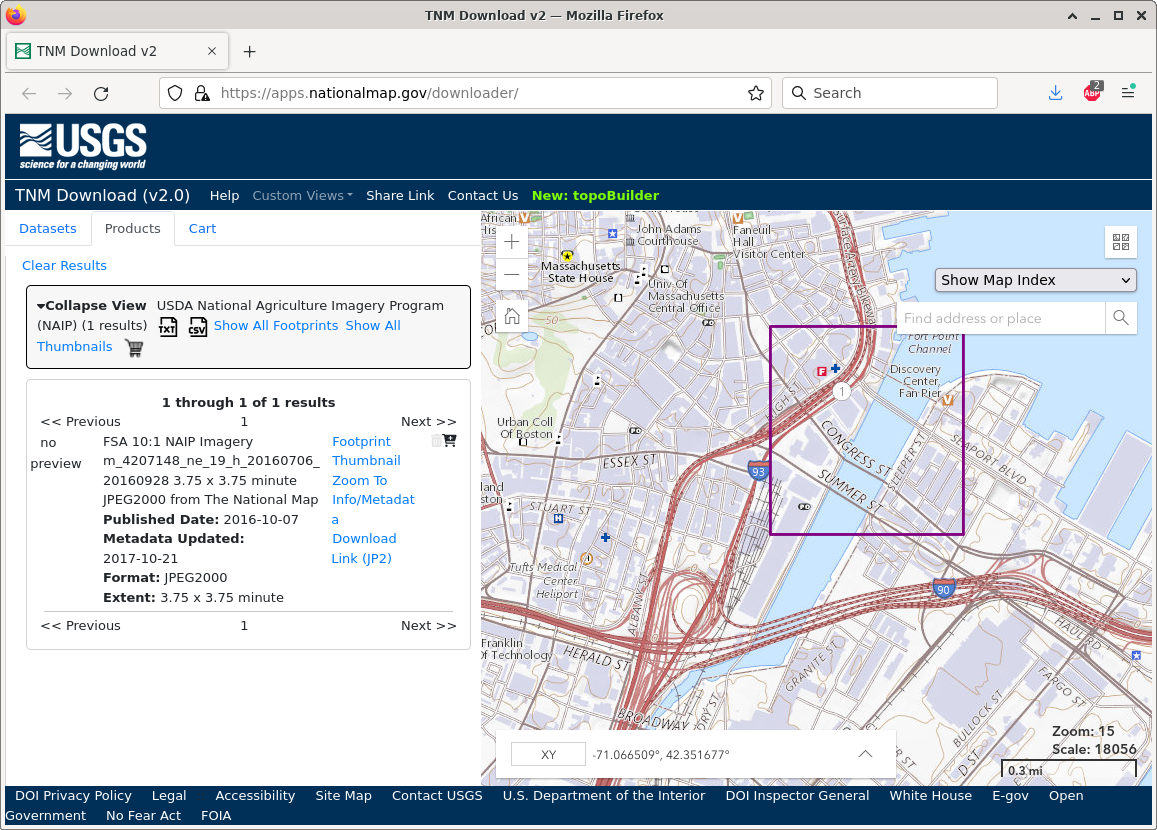
The USGS National Map download platform is the data source king -- supplying nearly all the data that I use for 3D prints of areas within the United States.
This repository’s most useful data sets for our purposes are: “Elevation Products->⅓ arc-second DEM” ,“Elevation Source Data->Lidar Point Cloud”, and “Imagery - NAIP Plus”. Draw a box, select a data source, search, and download - it’s simple and fast!

Though very similar to The National Map, USGS’s EarthExplorer portal allows discovery and download of current and historical global data, including declassified spy satellite imagery going back to 1960, single-frame aerial photos back to 1937, worldwide elevation data, line graphs, radar imaging, vegetation monitoring, and other datasets useful for global climate modeling. There’s a lot here, and it takes a while to peruse.
I most frequently use this site to get multiple high-resolution views of cities and landscapes from the “Aerial Imagery”->”NAIP” and “High Resolution Orthoimagery”.

3. The Copernicus Open Access Hub
The Copernicus Open Access Hub is my source for very recent high-resolution satellite photographs of Earth. The European Space Agency (ESA) provides this easy-to-use service with access to mind-boggling amounts of data.
You can download satellite images of your city with a resolution of 10 meters per pixel from as recently as today. It takes a little effort to extract useful full-color images from these approximately 1 GB data packets, but the effort is rewarded with wonderful color imagery of our beautiful planet.
Digging Deeper
To learn more about the tools that I regularly use to create 3D printable cities and mountains, read my other blog post: 11 Essential Resources for Your Digital Mapping Toolbox.
There is also a wealth of open-source software available for processing geo data, so if you want to dive deeper, consider trying QGIS or GRASS - both are open-source GUI applications for finding, viewing, manipulating, creating, and saving your own maps. If you’re no longer afraid of data or the command-line, the blog post mentioned above links to several of the tools that I rely on to create MiniCity and TinyMtn models.
I hope you’ve found something here that piques your interest -- even if you just want to enjoy exploring the wealth of fascinating and free data just a few clicks away.
